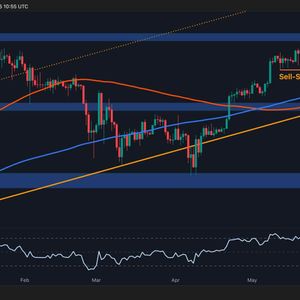
A trading expert has highlighted the importance of Bitcoin ( BTC ) holding above the $100,000 mark, warning that a drop below could trigger a sharp correction. Specifically, Master Ananda’s analysis shows that the $100,000 to $103,000 range now serves as Bitcoin’s key support. If this level fails, traders should brace for a red week followed by sideways consolidation before any meaningful recovery, according to a May 31 post on TradingView. Bitcoin price analysis chart. Source: TradingView Ananda noted that Bitcoin has already dipped into this zone, and the market is watching closely to see if it will hold or break under pressure. His analysis emphasized the critical nature of this range. Bitcoin recently reversed from highs near $112,000, pulling back to test support. If the level breaks, a deeper correction could follow, with downside targets near $88,000, a key Fibonacci retracement level. However, if support holds, the analyst expects a sharp rebound that could push Bitcoin to new highs above $130,000. “Between $100,000 and $103,000. If this level breaks, prepare to see Bitcoin producing another week red then consolidation, on and on, before the next high,” he said. While the short-term outlook is uncertain, Ananda remains bullish in the long run. He pointed out that retracements are typical and healthy in any uptrend. He also suggested the current pullback may offer a rare buying opportunity for those who missed earlier entries. Bitcoin’s price next key target This analysis comes as Bitcoin attempts to reclaim the $105,000 support zone , which could anchor a move to new highs. Despite the recent pullback, Bitcoin ended May with its highest monthly close on record. Looking ahead, market analysts believe Bitcoin could resume its bullish trend and target new highs above $120,000. In a June 1 post on X, Pseudonymous analyst Mags noted that Bitcoin is completing a bullish “cup and handle” breakout pattern, with a potential target of $125,000. Bitcoin price analysis chart. Source: Mags The pattern is a continuation setup where an asset forms a rounded bottom (“cup”) followed by a consolidation (“handle”). A breakout above the resistance neckline often leads to a rally roughly equal to the depth of the cup. This supports the view that Bitcoin’s breakout from the $65,000 to $70,000 resistance channel has laid the groundwork for further gains. Following the breakout, Bitcoin has already crossed the $100,000 threshold and continues to push higher. Bitcoin price analysis At the time of writing, Bitcoin was trading at $104,009, up 0.5% over the past 24 hours, though down 5.5% on the week. Bitcoin price analysis chart. Source: Finbold As it stands, Bitcoin’s immediate goal is reclaiming the $105,000 level, which could validate the current bullish momentum. However, a drop below $100,000 may spark a notable sell-off. The post Prepare to see Bitcoin produce a ‘red week’ if this level breaks, warns expert appeared first on Finbold .


