CoinInsight360.com logo CoinInsight360.com logo
America's Social Casino

CoinDesk 2025-06-20 16:28:18

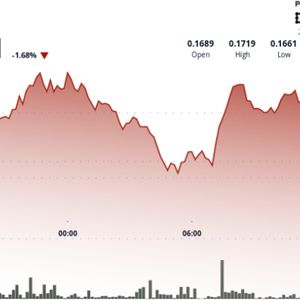
Dogecoin Rebounds From 16 Cents as Triangle Pattern Signals 60% Price Swing

Dogecoin is stabilizing near $0.170 after a sharp reversal from session lows, showing signs of accumulation as macroeconomic tensions rattle global markets. The meme cryptocurrency found strong support at $0.16, and is now coiling within a symmetrical triangle — a technical pattern known to precede major directional moves. News Background Analysts are increasingly focused on DOGE’s tightening technical structure. The current symmetrical triangle setup, combined with compressing volume and narrowing volatility, suggests a breakout could be imminent. Historical precedence for this pattern points to a potential 60% price move — though the direction remains unclear. As the Federal Reserve prepares to issue its next policy guidance and risk assets remain under pressure, DOGE’s positioning near a breakout point could present opportunity — or risk — for traders betting on a resolution. Price Action DOGE traded within a 2.7% range between $0.167 and $0.172 over the 24-hour period. A sharp 1.8% drop at 04:00 was followed by a strong recovery during the 07:00 hour, where volume spiked to 248 million units — the day’s highest. That rebound solidified $0.168 as a key support level. Price action then entered a consolidation phase between $0.170 and $0.172. Attempts to break above resistance at $0.172 were rejected during the 13:00 hour, with 193 million in selling volume. Downward pressure re-emerged around 13:45–13:51, when volume spiked again to 18.7 million, but DOGE held its ground at $0.170. Technical Analysis Recap DOGE posted a 2.7% 24-hour range, trading from $0.167 to $0.172. Sharp 1.8% decline early in session was reversed with 248M volume at $0.168 — now confirmed as support. Consolidation range established between $0.170–$0.172. Resistance tested and rejected at $0.172 during high-volume 13:00 hour (193M). Late-session dip saw volume surge to 18.7M; price defended $0.170 floor. Symmetrical triangle pattern tightening, with analysts calling for potential 60% move on breakout. RSI hovering near 50; MACD flattened — momentum indicators reflect compression phase.

Loe lahtiütlusest : Kogu meie veebisaidi, hüperlingitud saitide, seotud rakenduste, foorumite, ajaveebide, sotsiaalmeediakontode ja muude platvormide ("Sait") siin esitatud sisu on mõeldud ainult teie üldiseks teabeks, mis on hangitud kolmandate isikute allikatest. Me ei anna meie sisu osas mingeid garantiisid, sealhulgas täpsust ja ajakohastust, kuid mitte ainult. Ükski meie poolt pakutava sisu osa ei kujuta endast finantsnõustamist, õigusnõustamist ega muud nõustamist, mis on mõeldud teie konkreetseks toetumiseks mis tahes eesmärgil. Mis tahes kasutamine või sõltuvus meie sisust on ainuüksi omal vastutusel ja omal äranägemisel. Enne nende kasutamist peate oma teadustööd läbi viima, analüüsima ja kontrollima oma sisu. Kauplemine on väga riskantne tegevus, mis võib põhjustada suuri kahjusid, palun konsulteerige enne oma otsuse langetamist oma finantsnõustajaga. Meie saidi sisu ei tohi olla pakkumine ega pakkumine