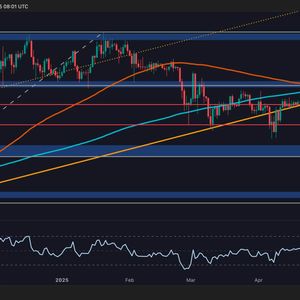
The daily BTC chart reveals a crucial technical break above a descending resistance line that has governed price action since December 2024. This trendline, drawn from the highs around $110,000, marks a shift in sentiment. As Bitcoin now trades above $84,900, the breakout signals the potential for a trend reversal or, at the very least, a relief rally. The breakout candle shows a strong upward close, suggesting that bullish forces are gradually gaining traction. MACD on the Daily: Momentum Shifting Towards Bulls The daily MACD indicator further confirms the bullish outlook, as the MACD line crosses above the signal line. This crossover, the first in several weeks, is often an early signal of upward momentum. While the histogram is just beginning to show positive bars, its increasing slope indicates that buying pressure is building. Holding above the $80,000 support adds further weight to the argument for a short-term rally. 4-Hour Chart: Bullish Continuation Likely After Breakout On the 4-hour chart, BTC has been forming a series of higher lows, signaling accumulation. After initially breaking above the descending trendline, Bitcoin has been consolidating above $84,000, a key support level. The consolidation resembles a bullish flag, which is often followed by a continuation. A break above $85,200 could see Bitcoin push higher toward the next resistance. Building Momentum for Further Upside The 4-hour MACD has been in positive territory for several sessions, with the MACD line holding above the signal line. The green histogram bars are expanding, reinforcing the ongoing bullish momentum. While volume is not yet explosive, the MACD strength across timeframes signals that any dips could quickly be absorbed, continuing the bullish trend. We are on twitter, follow us to connect with us :- @TimesTabloid1 — TimesTabloid (@TimesTabloid1) July 15, 2023 1-Hour Chart: Range-Bound Consolidation Above Breakout Level In the 1-hour timeframe, Bitcoin is moving within a narrow range between $84,400 and $85,200. This range consolidation after a breakout is a typical continuation pattern. The market is absorbing liquidity before potentially pushing higher. The formation of an ascending triangle is likely, especially if the price continues to print higher lows. A break above $85,200 could trigger a sharp move upwards . Supporting Intraday Upside Momentum The 1-hour MACD confirms the bullish intraday trend, with the MACD line above the signal line and green histogram bars showing gradual growth. Although the 1-hour timeframe offers less weight than higher timeframes, it still reinforces the bullish view when aligned with the 4-hour and daily charts. If the price holds above $84,000, the upward momentum is likely to persist. Price Prediction For Today With multiple bullish crossovers across timeframes and stable consolidation, Bitcoin is poised for further gains today . If the uptrend continues, $85,800 (TP1) is a logical target, with $87,000 (TP2) and $88,500 (TP3) possible on a breakout. Ideal entry remains within $84,500–$85,300, with stop-losses placed just below $82,800 to manage risk. The bullish trend is well-supported, and traders should aim for profit-taking as the price approaches these targets. Disclaimer: This content is meant to inform and should not be considered financial advice. The views expressed in this article may include the author’s personal opinions and do not represent Times Tabloid’s opinion. Readers are urged to do in-depth research before making any investment decisions. Any action taken by the reader is strictly at their own risk. Times Tabloid is not responsible for any financial losses. Follow us on X , Facebook , Telegram , and Google News The post Bitcoin Price Projection For April 19, 2025 appeared first on Times Tabloid .


