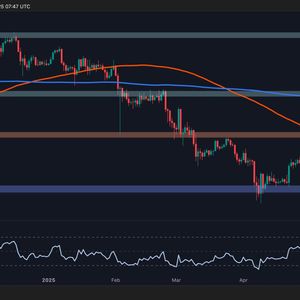
Ethereum has been struggling to reclaim the crucial 200-day MA of $2.7K, with the price roughly forming a double-top pattern. The recent price action hints at potential corrective consolidation toward the $2.2K threshold, before attempting a breakout. Technical Analysis The Daily Chart ETH has encountered strong resistance at the crucial 200-day moving average around $2.7K over the past week, reflecting a significant seller presence at this psychological level. The asset has lost upward momentum and is currently displaying a double-top formation—a classic bearish reversal pattern. This structure signals increased profit-taking and distribution, suggesting a probable short-term corrective phase targeting the $2.2K support zone. This retracement phase could serve as a healthy reset, attracting new demand at lower levels and providing the necessary momentum for a fresh breakout above the $2.7K resistance. Structurally, Ethereum remains confined between the 100-day and 200-day moving averages, setting the stage for a potential bullish breakout in the coming weeks. The 4-Hour Chart On the lower timeframe, Ethereum’s weakening bullish momentum is reflected in its price action within an ascending wedge, a bearish reversal pattern. This formation often signals diminishing buyer strength and increased seller dominance. Additionally, a clear bearish divergence between the price and the RSI indicator confirms this outlook, pointing to aggressive distribution near the current resistance. If ETH breaks below the wedge’s lower boundary near $2.4K, a pullback toward the $2.2K level becomes the most likely scenario. However, an unexpected breakout above the wedge could trigger a short squeeze, fueling a renewed rally toward higher resistance levels. Onchain Analysis Ethereum continues to hover below a critical resistance range, keeping investors on edge about the likelihood of a bullish breakout. While price action alone has provided mixed signals, insights from the futures market shed light on underlying sentiment shifts that could shape the asset’s next major move. One of the most telling indicators is the ETH Taker Buy-Sell Ratio, which measures whether aggressive market orders are dominated by buyers or sellers. Aggressive orders, those executed at market price, typically reflect urgency and strong conviction from market participants. Recently, this ratio’s 14-day moving average has seen a notable decline, pointing to increased aggressive selling activity. This trend suggests that bears are regaining control, triggering a wave of profit-taking and distribution as Ethereum struggles near resistance. If the selling pressure persists and the ratio continues trending downward, Ethereum could undergo a deeper correction, with the $2.2K support emerging as a likely target. However, if this aggressive selling is primarily driven by short-term players or “weak hands,” it could represent a healthy consolidation phase before a broader bullish breakout resumes. In short, Ethereum’s next direction hinges on whether the current selling momentum intensifies or exhausts, in the face of growing mid-term demand. The post Ethereum Price Analysis: Is ETH Primed for a ‘Healthy’ Correction? appeared first on CryptoPotato .


