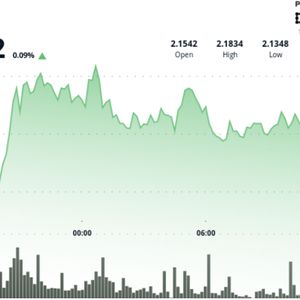
XRP is tightening its trading range near $2.15, signaling a potential breakout as majors remain rooted to the whims of macroeconomic tensions. The token's current price action reflects an extended accumulation phase, with technical indicators showing decreasing volatility and firm support around the 38.2% Fibonacci retracement level. News Background XRP’s recent stability comes as broader economic forces loom large. Escalating trade tensions between major economies and diverging central bank policies continue to pressure risk assets, creating headwinds for crypto investors. Despite this, XRP has maintained a steady price floor following its explosive January rally to $3.39. Ripple’s legal standoff with the U.S. SEC remains a key wildcard. Settlement talks are reportedly ongoing, and speculation continues to build around a potential XRP spot ETF, with Franklin Templeton's application delayed but still under consideration. Meanwhile, Ripple’s leadership claims that XRP could capture up to 14% of SWIFT’s transaction volume — a massive leap in institutional use case. The crypto market’s cautious tone has not dampened interest in Ripple’s cross-border payment infrastructure. And with technical compression now peaking, traders are watching closely for signs of a confirmed breakout or breakdown. Price Action XRP traded within a narrow 24-hour range from $2.135 to $2.186, showing signs of a market coiling for a move. A bullish burst between 13:21 and 13:30 pushed prices from $2.151 to $2.158 on high volume, suggesting growing buyer interest. The price briefly pulled back to $2.150 in the 13:47–13:48 window — a critical zone that aligns with the 38.2% Fibonacci retracement from January’s high. Technical Analysis Recap XRP posted a 2.38% trading range over 24 hours, from $2.135 to $2.186. Support held at $2.133 with above-average volume; resistance formed near $2.186. Current trading band between $2.150–$2.165 shows narrowing volatility — a classic pre-breakout structure. Fibonacci support at $2.152 (38.2% retracement) remains intact. Volume spike confirmed local high at $2.158 during 13:21–13:30. Sharp dip to $2.150 tested key support; quick recovery to $2.152 shows buying strength. RSI and MACD trending flat, indicating a potential breakout setup once volume returns. Disclaimer: Portions of this article were generated with the assistance of AI tools and reviewed by CoinDesk’s editorial team for accuracy and adherence to our standards. For more information, see CoinDesk’s full AI Policy.


