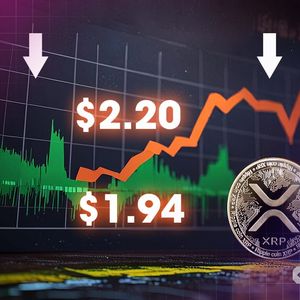
XRP has been on a rollercoaster ride in the past 24 hours, crashing below $2 and now trading at $2.40 after a 28% surge from the local bottom. Interestingly, the XRP price appears to have beaten other leading altcoins to the punch with its 5.12% uptick since 00:00 UTC, affirming bullish end-of-year projections for the altcoin . While XRP did not escape the liquidation event unscathed, suffering a 12.34% drawdown, it has been the quickest to recover. Coupled with a 12% jump in trading volume to $24 billion, it seems that the reversal is backed by significant momentum. Is XRP Clear of the Crash? The uptick today represents a play-out of bullish predictions by expert analyst Casi Trades on X . In her recent analysis, she noted two scenarios that could lead to a reversal and set the XRP price well on the path to a new all-time high. Though the first scenario did not come to fruition, the second one has, with the 0.382 Fibonacci retracement level ($1.94–$2.04) proving a “pivot point” in the recent downtrend, following an ABC pattern. Here’s some positive perspective on this correction: A .382 retrace still aligns our extension targets perfectly with #XRP 's previous ATH—markets love this kind of symmetry! Unless $1.94 is broken, this target holds! https://t.co/VxDAq7Pyy5 — CasiTrades (@CasiTrades) December 10, 2024 The successful bounce from this support has re-ignited bullish momentum, seen in today’s surge, and reaffirmed a potential path to XRP’s past all-time high at $3.50. Particularly as the bearish symmetrical triangle pattern breakout neared its target, $1.94 does seem a credible bottom to the correction. XRP Price Analysis: Is a New All-Time High Next? Going forward, XRP’s path to a new all-time high seems credible with the formation of an ascending broadening wedge since early November. XRP / USDT 4H Chart, ascending broadening wedge pattern. Source: Binance. The lower support trendline of the pattern affirms a local bottom for a correction, aligning with Casi’s support zone at $1.94. While a retest of the 50 SMA may temporarily stall today’s growth, the MACD line indicates bullish sentiment with a crossover above the signal line. This move, in recent history, has consistently led to significant upticks in the XRP price. Therefore, a push to $3.50, representing a 50% advance on current prices, seems plausible. However, the analyst notes the range between $3.50 and $3.74 remains a critical pivot zone where the market will define future trends. The post XRP Price Drops Below $2.20 – Was $1.94 the Key to Its Next Bullish Surge? appeared first on Cryptonews .


