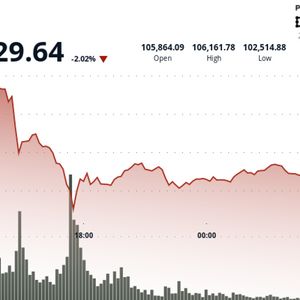
Perhaps just like $BTC it seems, the big altcoins are just not ready to have the bulls pull the trigger, at least not yet. There may still be the odd week or two, or perhaps even longer before the crypto market pulls itself out of the sideways price action it has been following for more than a month now. The continual rise of Bitcoin Dominance Source: TradingView Bitcoin Dominance is still rising. It’s a slow rise, but it’s continual, and is showing no signs of stopping. In fact, this chart has been up and to the right since September 2022. All this said, is there the chance that the altcoins can come back against $BTC? Yes, of course. There can always be a dip that enables the altcoins to run. Nevertheless, with $billions coming into $BTC by way of whales, sovereigns, and company treasuries, it will probably be hard for the vast majority of the altcoin market to keep up. $ETH faces initial rejection Source: TradingView The short-term chart for $ETH reveals that the price has just been rejected at the descending trendline. This coincides with a cross-down of the Stochastic RSI. That said, there is very strong support at $2,500, so the breakout might still take place. If the support doesn’t hold, the next support level is at $2,400. “Steady Eddy” $BNB rejected from trendline Source: TradingView $BNB is a real “steady Eddy” among the top layer 1 altcoins. The latest ranging price action has been in force since 9 May, with a floor at $640 and resistance at $674. The price is now quite near to that bottom support, and is being channeled into a breakout area formed by the support and the descending trendline. Given that the Stochastic RSI indicators are shaping to turn back down, it may be that the price is further squashed into the point of the triangle. Descending triangles would generally break down rather than up, so this pattern will need to be watched closely. Can $SOL hold support and attempt another breakout? Source: TradingView $SOL is continuing to track down, with the latest attempt to break beyond a small descending trendline looking like it has been foiled. That said, the nearby support level is a strong one at $143, while further supports are underneath at $136, and $125. The Stochastic RSI indicators are posturing to roll over and come back down again, but if support can hold, another attempt at breakout could take place. Disclaimer: This article is provided for informational purposes only. It is not offered or intended to be used as legal, tax, investment, financial, or other advice.


