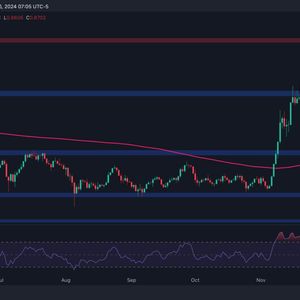
The post Cardano Price Prediction Today: What’s Next After 17% Dip? appeared first on Coinpedia Fintech News Cardano (ADA) has dipped below the $1 level and is down by more than 17 percent in the last 24 hours. The altcoin is currently facing significant resistance in the range of $1.12 to $1.24 on the weekly chart. The majority of the top 10 cryptocurrencies have slipped into the danger zones, with altcoins like ADA, XRP and DOGE recording maximum losses. Support Levels to Watch As anticipated, the price has been struggling in the current area, showing signs of difficulty in breaking above this range. If ADA manages to break out and close a weekly candle above $1.23 or $1.24, the next immediate resistance level will be around $1.46, based on previous highs. Further resistance lies near the 78.6% Fibonacci level at $1.76 to $1.77. If the price of ADA pulls back, there are several key support levels to watch near $0.90 and $0.82. A move below $0.82 could suggest a shift in the market, so traders should keep an eye on these levels for potential signs of a deeper pullback. Bearish Divergence on the Short-Term Charts ADA is showing signs of a bearish divergence. The price has formed higher highs, while the Relative Strength Index (RSI) has confirmed lower highs. This suggests that bullish momentum has faded, and there’s a likely chance of sideways price action or even a slight pullback in the coming days or weeks. Long-Term Outlook: Bullish Market Continues While ADA is facing short-term resistance and bearish divergence, the larger market remains in a bullish phase. ADA’s price is still maintaining a positive long-term outlook, but it’s navigating through this critical resistance zone for now. However, the overall market sentiment remains bullish. For traders, it’s essential to monitor key price action to determine whether a breakout or pullback is on the horizon.


