Crypto Potato
2025-01-15 13:04:45
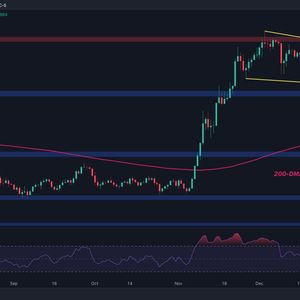
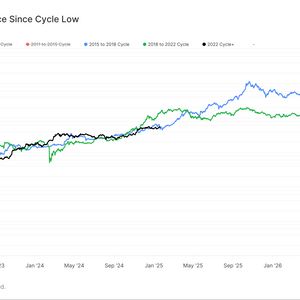
Cardano Price Analysis: Is ADA Ready to Surge Past the $1.3 Barrier?
Most Read News
Read the Disclaimer : All content provided herein our website, hyperlinked sites, associated applications, forums, blogs, social media accounts and other platforms (“Site”) is for your general information only, procured from third party sources. We make no warranties of any kind in relation to our content, including but not limited to accuracy and updatedness. No part of the content that we provide constitutes financial advice, legal advice or any other form of advice meant for your specific reliance for any purpose. Any use or reliance on our content is solely at your own risk and discretion. You should conduct your own research, review, analyse and verify our content before relying on them. Trading is a highly risky activity that can lead to major losses, please therefore consult your financial advisor before making any decision. No content on our Site is meant to be a solicitation or offer.


