CoinInsight360.com logo CoinInsight360.com logo
America's Social Casino

CoinDesk 2025-06-25 10:45:07

Shiba Inu Whales Snap Up 10T SHIB, Prices Chalk Out Descending Triangle Pattern

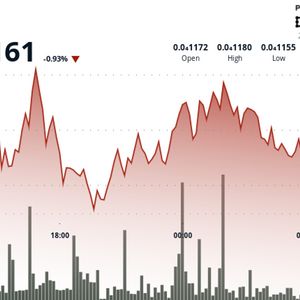
Shiba inu (SHIB) whales went bargain hunting early this week after prices dropped to a 16-month low of $0.00001005. According to CoinDesk's AI research, whales purchased 10.4 trillion SHIB tokens, worth over $110 million, on Monday, marking the largest daily accumulation in five months. The whale action has likely contributed to the cryptocurrency's 17% price bounce from the 16-month low reached Sunday. Note that the broader crypto market has stabilized following the initial knee-jerk reaction to the tensions in the Middle East. BTC, which fell below $100K over the weekend, last changed hands near $106,000. Market data indicate that SHIB is maintaining a generally constructive posture, with higher lows forming a subtle uptrend channel. The token found significant volume support at the $0.00001158 level during the 24 hours from June 24, 09:00 to June 25, 08:00, with trading volume surging to 439 billion, well above the daily average. This accumulation at support levels suggests the potential for continued upside momentum if the $0.00001175 resistance can be decisively cleared. As of writing, SHIB traded at around $0.00001162 on major exchanges, according to CoinDesk data. Key AI insights Higher lows formed a subtle uptrend channel, suggesting accumulation at support levels and potential for continued upside momentum if $0.00001175 resistance is cleared. During the 60 minutes from 25 June 07:06 to 08:05, SHIB climbed from $0.00001169 to $0.00001171, representing a 0.2% gain. A significant price surge occurred between 07:25-07:27, with volume peaking at 12.36 billion SHIB as prices reached the session high of $0.00001175. Price action formed an ascending channel with higher lows, though a sharp correction at 08:03 tested the $0.00001171 support level, suggesting consolidation after the earlier rally. Hourly chart SHIB's recovery has stalled since Tuesday, with prices trading in what appears to be a descending triangle, characterized by a falling trendline and a horizontal support line. A price move through the descending trendline would signal a continuation of the recovery rally, exposing the June 16 resistance above $0.00001230. Conversely, a breakdown of the triangle would signal a bearish reversal lower.

Feragatnameyi okuyun : Burada sunulan tüm içerikler web sitemiz, köprülü siteler, ilgili uygulamalar, forumlar, bloglar, sosyal medya hesapları ve diğer platformlar (“Site”), sadece üçüncü taraf kaynaklardan temin edilen genel bilgileriniz içindir. İçeriğimizle ilgili olarak, doğruluk ve güncellenmişlik dahil ancak bunlarla sınırlı olmamak üzere, hiçbir şekilde hiçbir garanti vermemekteyiz. Sağladığımız içeriğin hiçbir kısmı, herhangi bir amaç için özel bir güvene yönelik mali tavsiye, hukuki danışmanlık veya başka herhangi bir tavsiye formunu oluşturmaz. İçeriğimize herhangi bir kullanım veya güven, yalnızca kendi risk ve takdir yetkinizdedir. İçeriğinizi incelemeden önce kendi araştırmanızı yürütmeli, incelemeli, analiz etmeli ve doğrulamalısınız. Ticaret büyük kayıplara yol açabilecek yüksek riskli bir faaliyettir, bu nedenle herhangi bir karar vermeden önce mali danışmanınıza danışın. Sitemizde hiçbir içerik bir teklif veya teklif anlamına gelmez